Core Values Proplems

Turn Silent Walkouts into Sales

How much revenue is lost to 'invisible' customer walkouts?

Without visibility, retailers cannot track unserved shoppers or lost revenue. AI camera analytics makes these 'silent walkaways' measurable, enabling real-time action to improve retention and sales
Our Solutions Our Solutions

Optimize Customer Service Efficiency

Report dwell time of customers in service zones.

Track customer time spent in service zones such as waiting area, payment area and consultation area to evaluate service speed, including wait times for assistance, order processing, and consultations.
Service Waiting Time solution 1

Report the percentage of customers leaving unserved

Track customers who enter the service zones but leave before receiving assistance. This indicates potential service bottlenecks or long wait times leading to customer abandonment.
Service Waiting Time solution 2
workflow Our Workflow

How It Works

Business Objective
Strategy
KPIs
Definition
Improve CX
Reduce service time
Service delivery time
Service coverage rate
Service rating
Checkout abandonment rate
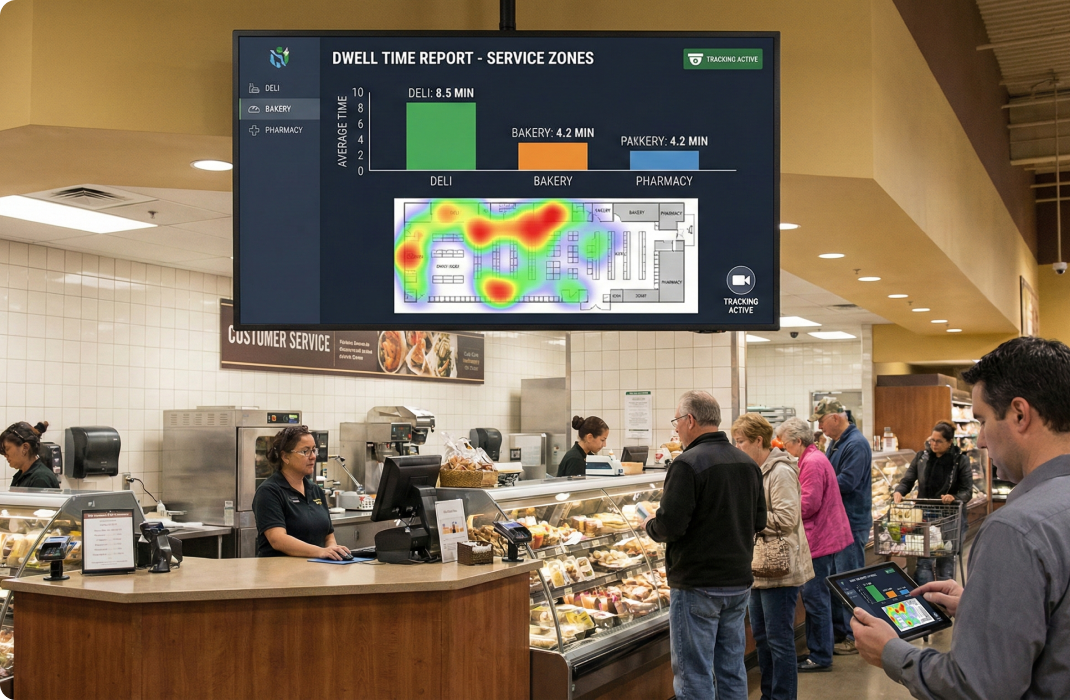
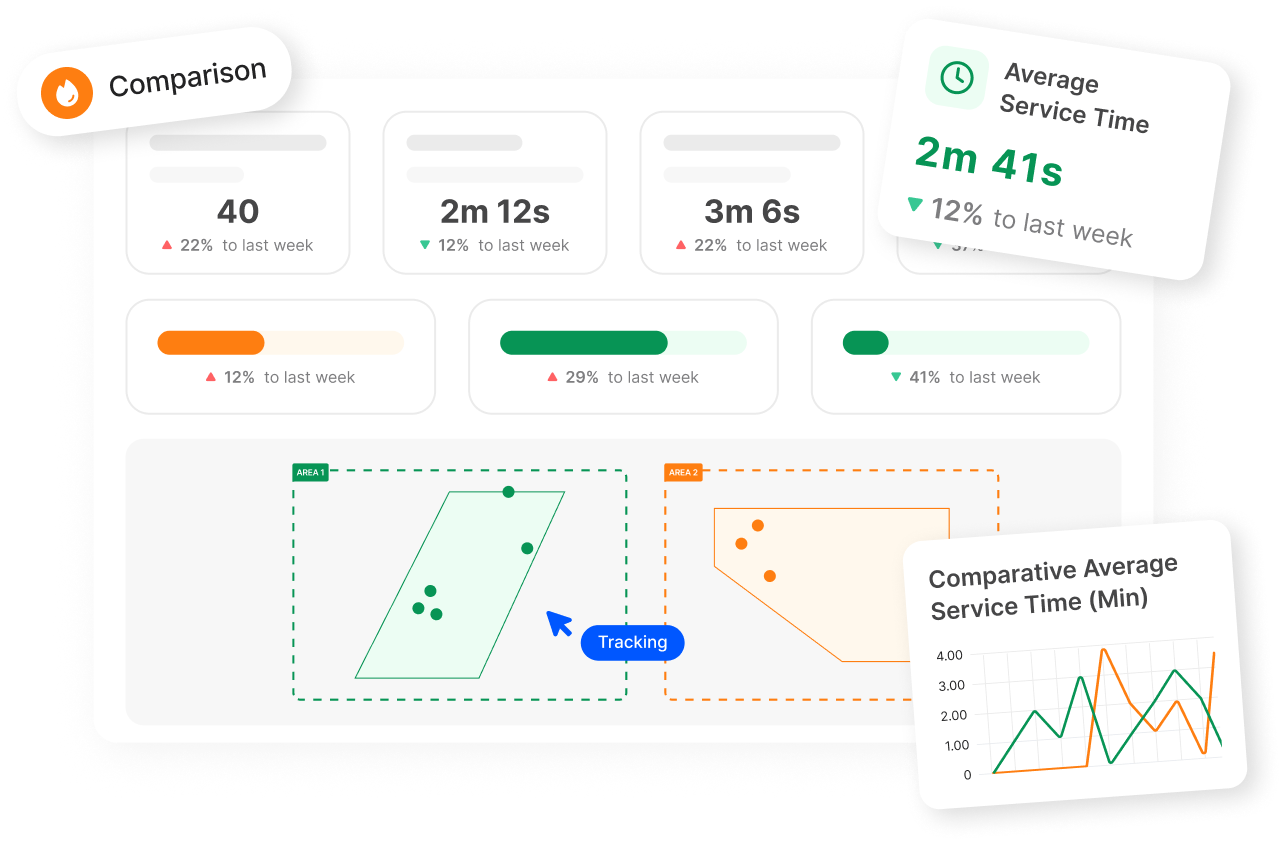
Measures the total time taken to serve a customer in store, including waiting time, processing time and consultation time
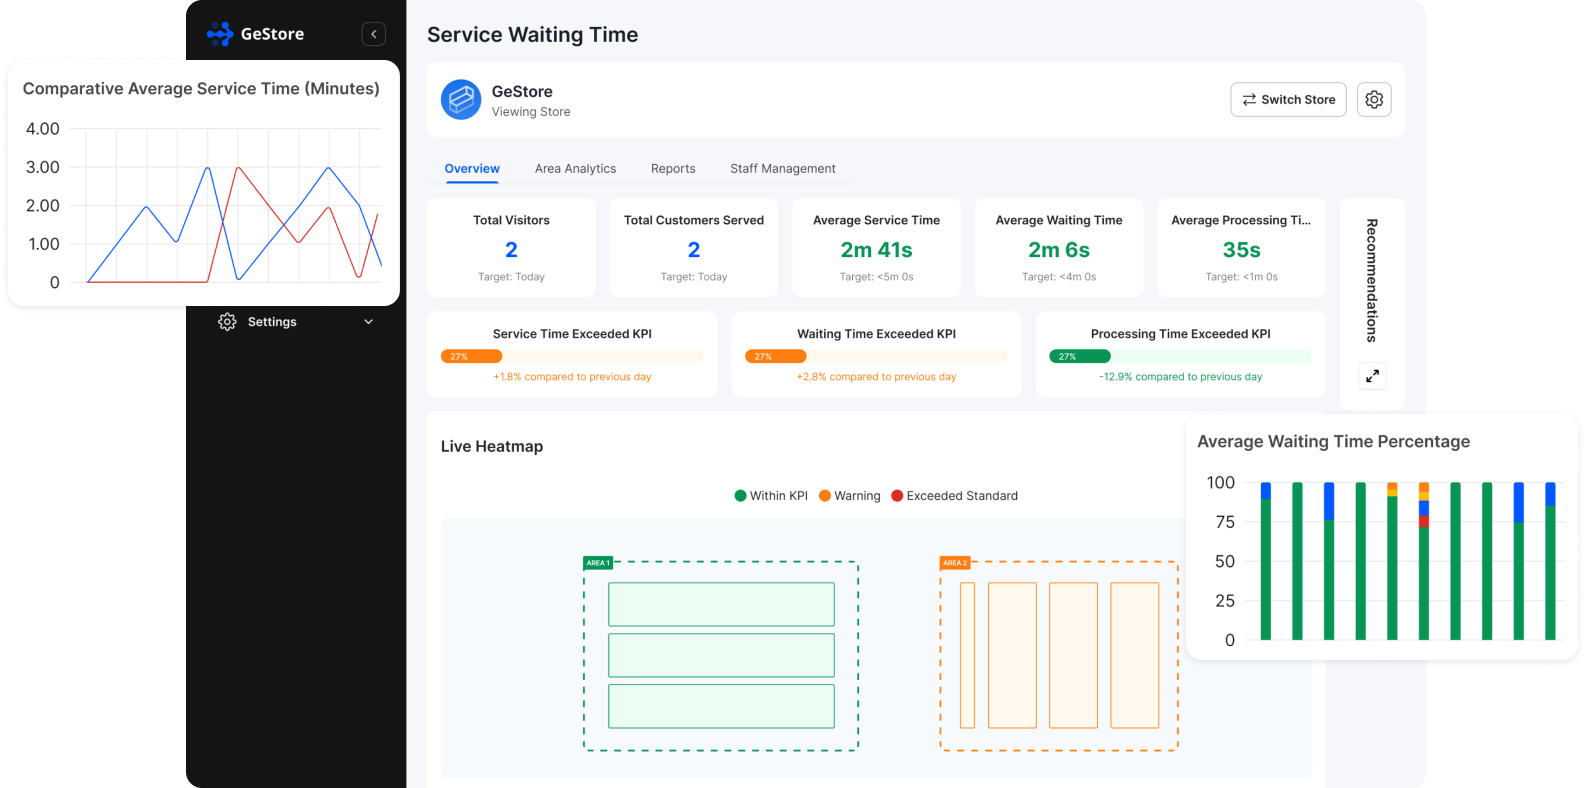
Number of customers being served / Number of customers entering the waiting area
Customer feelings about in-store shopping experience
Percentage of customers leaving the waiting area before being served
GeStore
Client

How can retailers leverage dwell time data to measure the business-critical impact of long queue status in store?

menu
Measuring potential loss sales
The biggest challenge for retailers is measuring sales losses from customers who leave without being served. Without visibility into wait times and service responsiveness, businesses cannot track abandonment rates, the impact on sales conversion, or overall service efficiency.
flash lighting
Estimate Lost Sales with AI camera
  • Number of customers who leave service zones without being served
  • Average wait time before abandonment
  • Historical sales conversion rates for served customers
formula Potential loss sales = (Number of customers who left unserved) × (Expected conversion rate if served) × (Average transaction value per customer)

Dashboard/API Collaboration

Dwell time data is visualized through the Gestore standard dashboard, offering real-time visibility into waiting and consultation area. Data can also be integrated with customer systems and applications such as POS, inventory, and weather through API connections, enabling a wide variety of reporting purposes.
Service Waiting Time Dashboard/API Collaboration

Ready to Transform Your Retail Business?

Join leading retailers using GeStore to drive growth and efficiency.