Analyze
customer interest in digital displays
Leverage
heatmap analysis and foot traffic data to assess whether customers typically enter marketing
zones during their store visits and to identify areas with high customer density. These
insights enable data-driven decisions for the optimal placement and investment in in-store
digital displays.
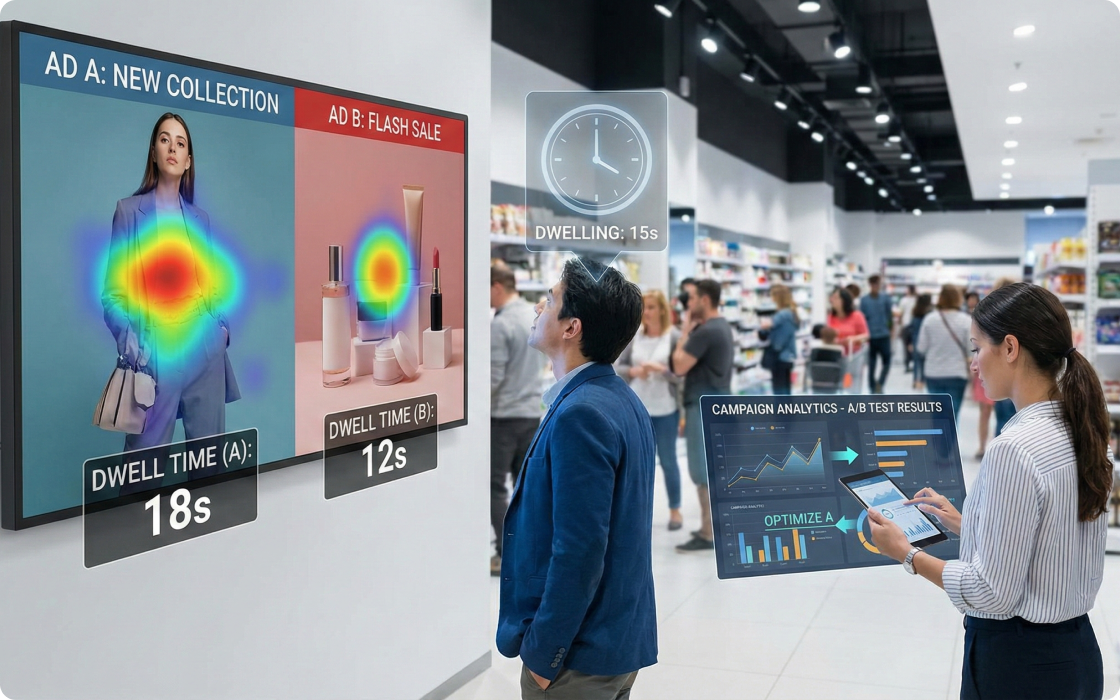
Evaluate the
effectiveness of digital displays
Use customer
dwell time in front of digital ads panels as a key performance indicator of campaign
engagement. Apply this data to perform A/B testing and fine-tune your campaign strategies
for greater impact..
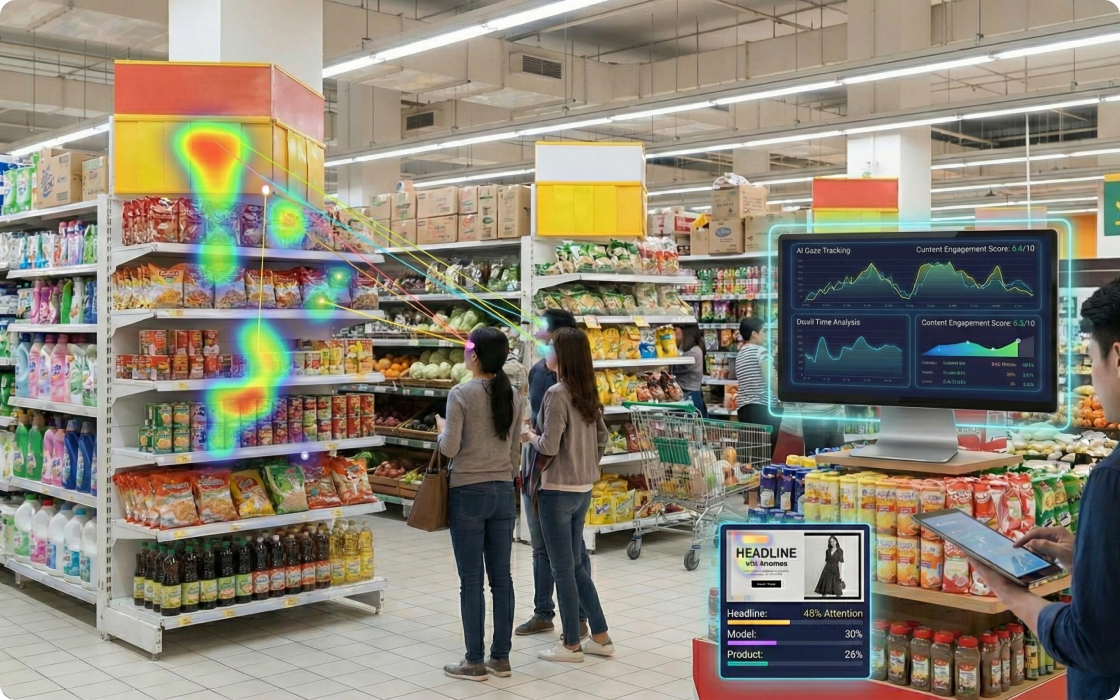
Analyze
content-level engagement
Use
AI-powered gaze tracking and dwell time analysis to identify which specific content on
digital ads panel captures the most attention, enabling data-driven decisions to optimize
messaging, layout of content.
Analyze
product engagement on shelves
Track eye
gaze to identify which products customers typically pay attention to on the shelves. By
linking this engagement data with point-of-sale (POS) transactions, you can evaluate the
correlation between product interest and actual sales. These insights help you understand
customer purchase intent and optimize product placement.
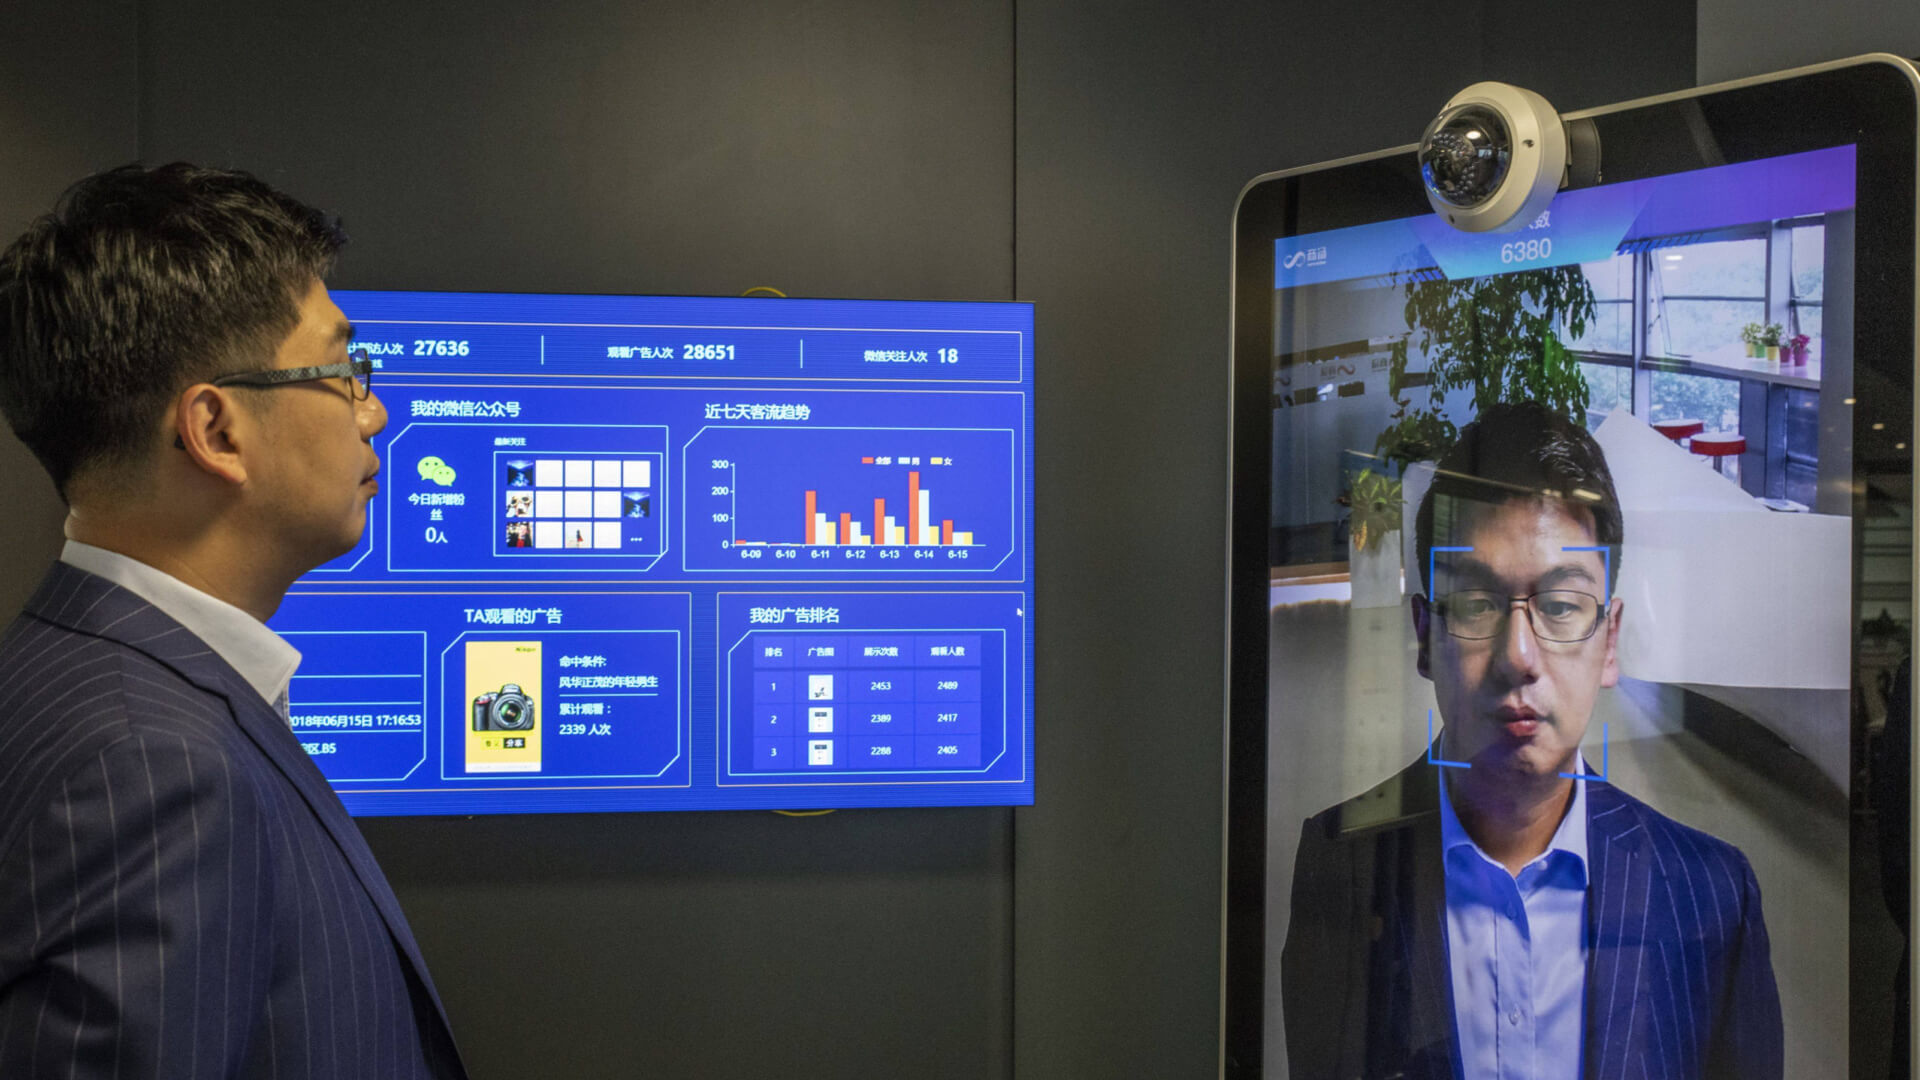
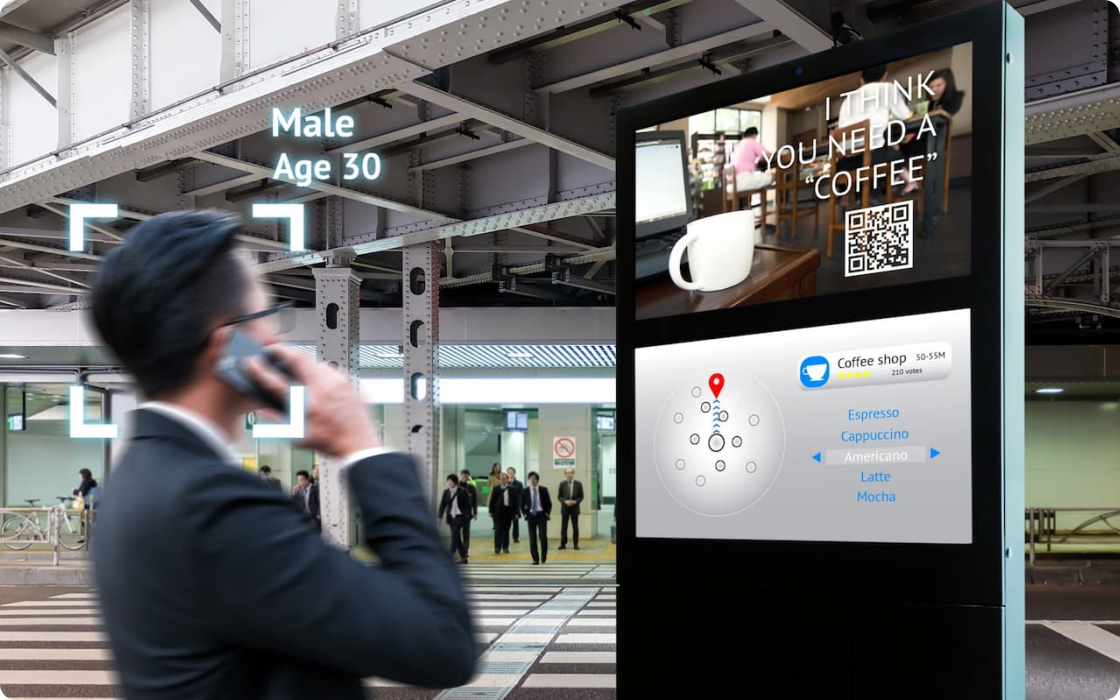
Detect age
group and gender
Accurately
profile visitors by gender and age, helping you better understand customer engagement with
digital signage and product displayed on shelves by demographics.